
An Analysis of Greenhouse Gas Emissions
- Abdul-Sherrif Saaka
- Jun 3, 2022
- 2 min read

Updated: Feb 24, 2023
Because of my background in Geo-Engineering and as someone who very much does not want the earth to die I am always very interested in anything concerning earth sciences. And in this project I explore that. I set out to create a dashboard counter to keep me informed of Greenhouse Gas(GHG) emissions . This project consists of some data cleaning with Excel and Power Query, a simple model made with Power Pivot. And some visualizations with Power Bi to get a quick look at the state of our fight against excessive GHG emissions. Stay with me.
Data cleaning
"Data always has to be checked and cleaned no matter how clean it looks" is the one quote from a video I watched that stuck with me because cleaning data is what I enjoy doing most in the entire data analytics process. It's tedious and fun. Let's have a look at the initial data.
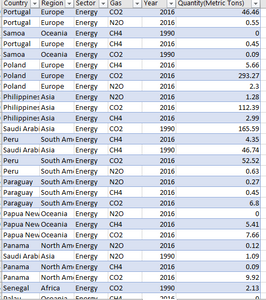
1.1 Sample of initial data

I imported this data into Power Query for transformation. I created a Year table that included just the years, and a few other dimension tables. They were not needed for this task but I wanted to test and showcase my growing modeling skills. Next I checked for errors, data types, inconsistent formatting and empty records. I removed errors and empty records and unpivoted the year columns which contained emission values for each year. Unpivoting is the process of transposing data from wide to long to make it easier for analysis. Although, I must add, it usually makes reading a little harder. But not to worry, I'll have everything summarized in an interactive dashboard later on in this post. At the end of my cleaning process my dataset looks ready for analysis.
1.2 Clean data


Data Modeling
Since I had multiple tables at this point that I would use in my visualizations, I had to create a model to create relationships between the tables. I saved and loaded the clean data into the data model, opened up power pivot and created a simple data model. The year table which is a dimension table is connected to the fact table which is the emissions table by the year column, the region by the country column, and sector table by the sector column.
2.1 Simple data model


Visualizations
From the data model, I created my visualizations and for the first time used "Smart Narrative" to gain insights and compare them to my own insights.
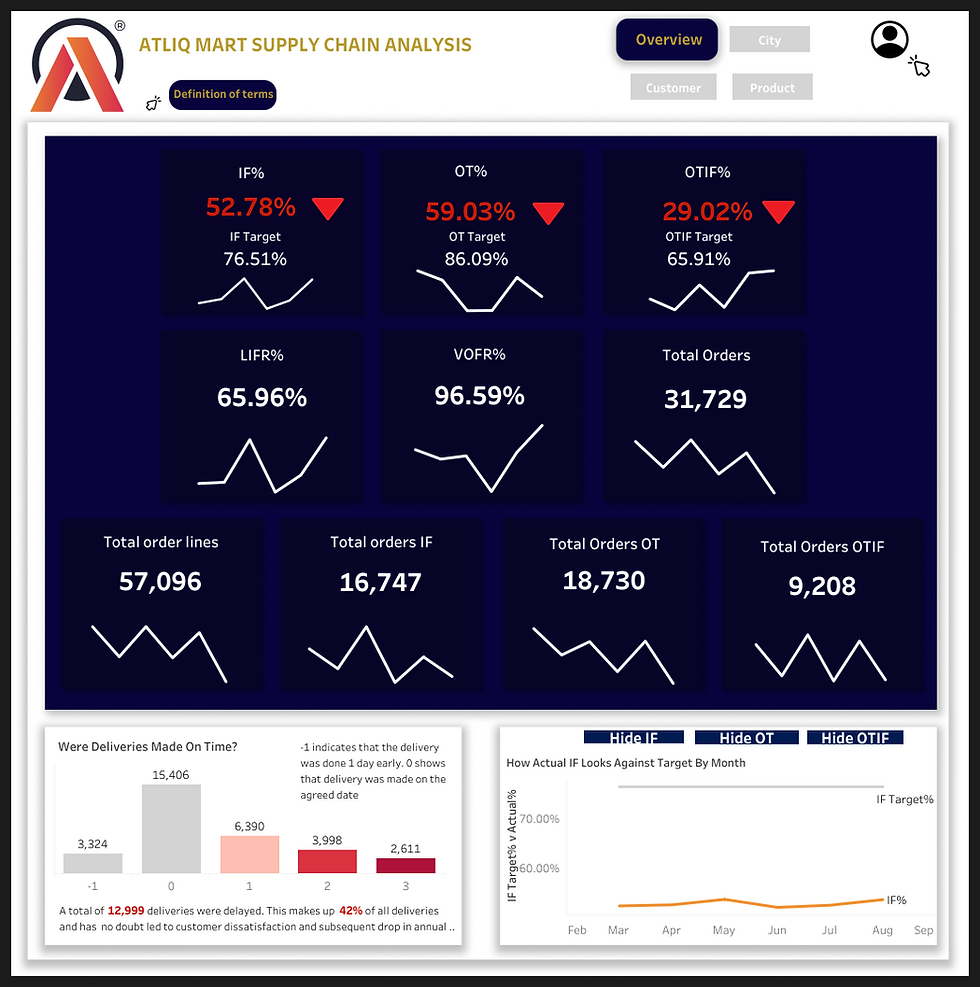
3.1 Dashboard
Follow this link to go to the interactive dashboard. If you you as curious as me about the earth, you'll find some answers to some questions you might have.
Conclusion
Because of all the processes I went through with power query, all I need do when I have a hold of newer data is load it into the local database connection I have created with Power query and visualization will be updated. That is why I love power query and always try to clean up data with it. It automates stuff for you. It's like recording a nice little macro. Thank you for sticking with me. And as always, reach out if you have any questions or suggestions. I am constantly learning.


Comments