
ATLIQ SUPPLY CHAIN ANALYSIS
- Abdul-Sherrif Saaka
- Nov 28, 2022
- 1 min read

Updated: Dec 7, 2022
This is a part of Codebasics' resume project series. You can check them out at https://codebasics.io/event/codebasics-resume-project-challenge. I worked on this project with Excel to clean the data and Tableau to create visualizations
PROBLEM AND TASK
Some key customers with Atliq haven't renewed their annual contract. Management suspects this is due to some service issues and want to track the "On-Time" , "In-Full" and "On Time In Full" delivery service levels for all the customers to enable them fix problems where there are any.
My role as a data analyst is to collect and analyze data and create dashboards with the most important KPIs and insights for the supply chain team to enable a quick data-driven resolution of all problems by management. Below are my dashboards with my findings
Definition of Abbreviations on the dashboards
1 LIFR % - Line Fill Rate - Number of order lines shipped In Full Quantity / Total Order Lines
2 VOFR %- Volume Fill Rate- Total Quantity shipped / Total Quantity Ordered
3 OT %-On Time Delivery %- Number of orders delivered On Time / Total Number of Orders
4 IF %- In Full Delivery %- Number of orders delivered in Full quantity / Total Number of Orders
5 OTIF %- On Time In Full %- Number of orders delivered both IN Full & On Time / Total Number of Orders
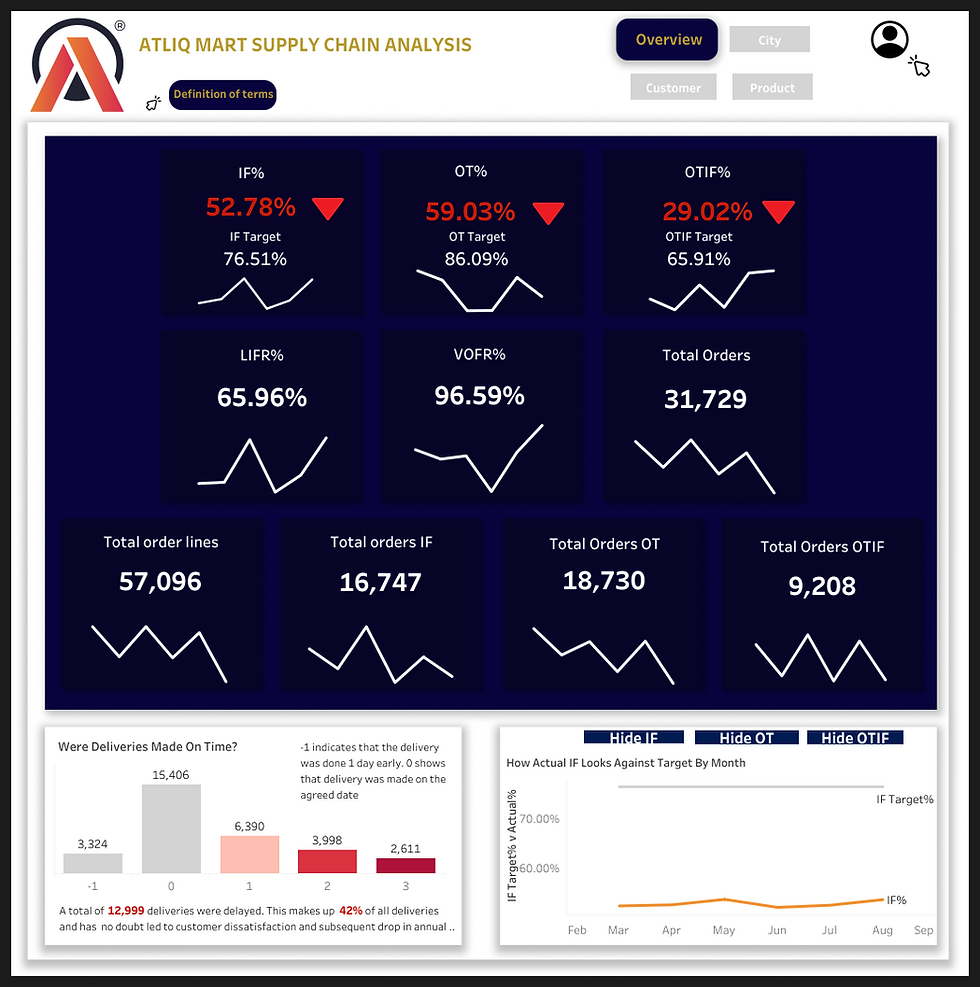
Dashboard Page 1
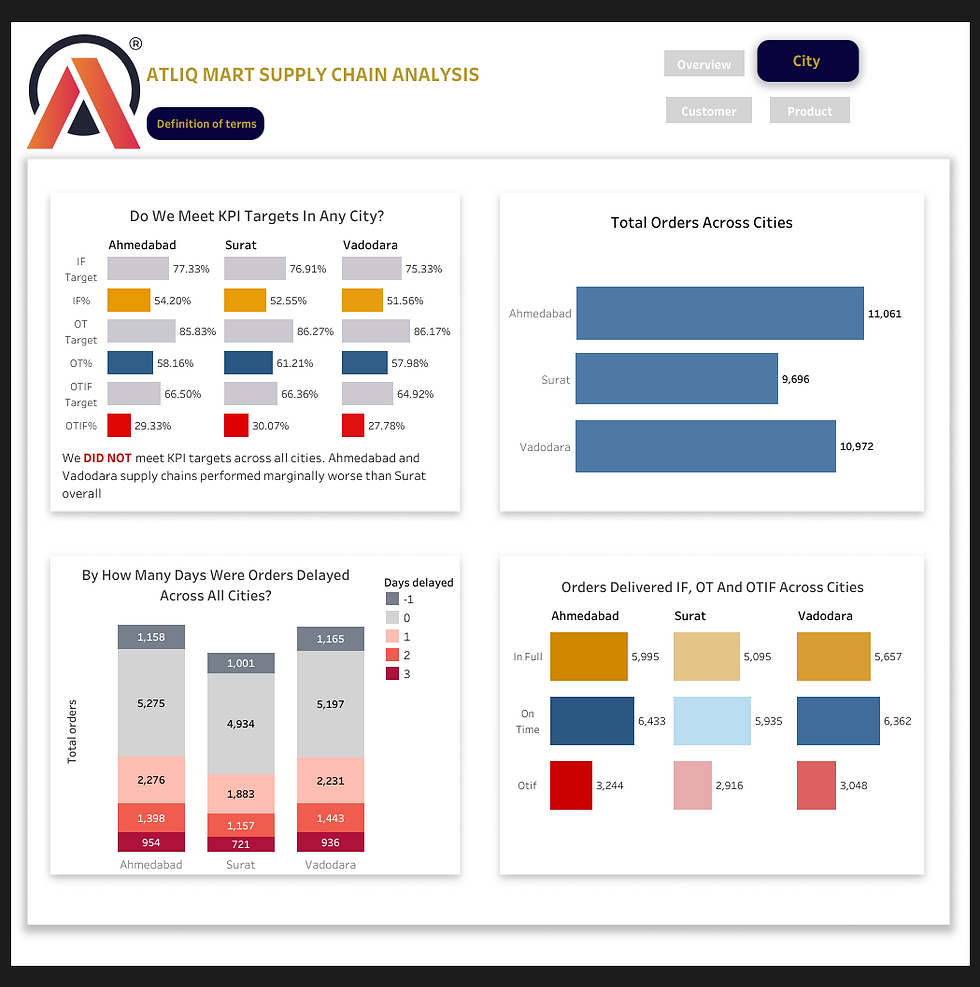
Dashboard Page 2
Visit my Tableau Public profile at https://public.tableau.com/views/ATLIQMARTSUPPLYCHAINANALYSIS1/Overview?:language=en-US&:display_count=n&:origin=viz_share_link to get the fun interactive version of this dashboard


Comments