
Business Performance Dashboard
- Abdul-Sherrif Saaka
- Aug 10, 2025
- 1 min read

Data Acquisition
In this BI project, I create a database in SQL Server, import chunks of CSV files into the database and create a table by unioning all the individual CSV files for transactions. There are 5 CSV file chunks. The two remaining chunks are sitting on a SharePoint site that I created for this project.
SELECT * INTO Transactions
FROM [dbo].[sales_data_1]
UNION ALL
SELECT *
FROM [dbo].[sales_data_2]
UNION ALL
SELECT *
FROM [dbo].[sales_data_3];
I again uploaded separate CSV files for Customers and Products.
Power BI Development
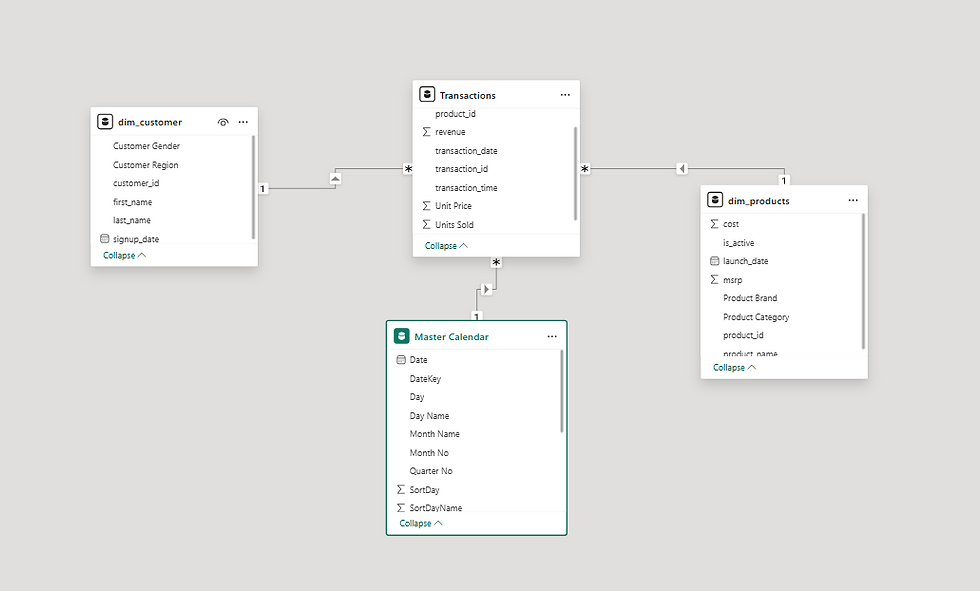
I load all these tables into Power Query with a Power Query parameter. A parameter in this instance allows for you to define the path to the data source one and use it repeatedly load different tables into Power Query. Since there are two CSV files for sales sitting on SharePoint, I load them as well into Power Query and append that to the Transactions table loaded from my SQL database. The data is very clean so there is no need for transformations except promoting first rows as headers. After this, I load the tables into Power BI and create the data model
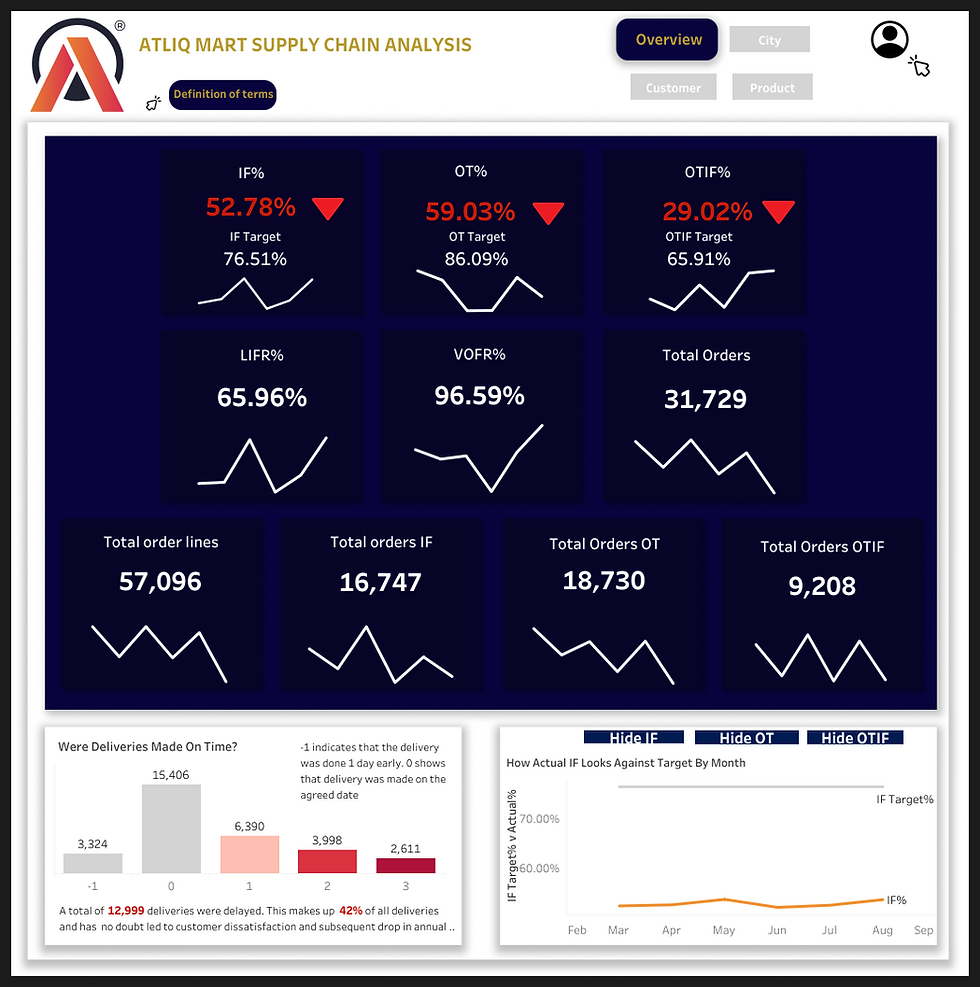
From here, the Power BI dashboard is built to provide and quick and clear analysis of the Business' performance in terms of products, customers, and transactions. Interact with the embedded dashboard below. In addition to the main dashboard, I created a paginated report to provide detailed information about individual transactions. Screenshots are attached below


Comments