
A SQL Analysis Of 4-year Sales Data
- Abdul-Sherrif Saaka
- Oct 24, 2022
- 7 min read

Updated: Feb 24, 2023
Hi. Happy to have you here. In this project I analyze a 4-year sales dataset and answer some important business questions with SQL. MySQL is the SQL flavor of choice for this project. SQL stands for Structured Query Language and it is the language you'll need to extract most of your data that is housed in databases. Some call it "sequel", others call it "es-queue-el" , I am not here to judge(ᶜᵃˡˡ ⁱᵗ ˢᵉᵠᵘᵉˡ), but whatever you call it, just stay with me to the end. Let's get into it!
Business questions
These are the questions I will be answering in this project
Q1 top 10 products by revenue across each zone
Q2 channels that generated the most revenue in each state
Q3 sales made per year
Q4 profit by year
Q5 profit margins by year
Q6 products that sold the most in each zone in each year
Q7 sales made when there is discount v no discount
Q8 profit made when there is discount vs no discount
Q9 revenue by product category
Q10 order quantity by product category and zone
Q11 top product category(sales) by quarter in each year
Q12 products that are never out of stock
Q13 products that are out of stock sometimes
Q14 profit margins by category
Inspecting data with Excel
To begin I opened my "salesdata.csv" file in Excel for an initial inspection and I see that the names of the columns do not follow naming conventions in SQL. For example there is a column named "order id" which might present some problems in SQL so I correct that to "order_id" and do same for all the other columns. The difference in these two names being the underscore. There are no missing values so my data is ready to import into MySQL.
Importing data into MySQL
Before I import my data i create a new schema for the new project. A schema is simply a container in a database that holds objects like tables.
CREATE DATABASE sql_project_001;After creating my schema named sql_project_001, I use the table import wizard in MySQL workbench to import the dataset. To ensure all records are successfully imported I run a select all query
SELECT * FROM sql_project_001.salesdata;I run a query to see the data type of all the fields
SELECT COLUMN_NAME, DATA_TYPE
FROM INFORMATION_SCHEMA.columns
WHERE TABLE_NAME = 'salesdata'
From the results of the query we see that order_date column is a varchar(text format) so I write a query to change to DATE data type. On my first two attempts I used CAST() and CONVERT() which both threw an error because both functions do not contain an argument for specifying the format of the original date. Which is what I needed to do here to help SQL convert my order_date from varchar to date. STR_TO_DATE() is the one to use here.
SELECT str_to_date(order_date, '%d %m %Y') order_date
FROM sql_project_001.salesdata;
Answering business questions
I checked for duplicates on the primary key(the order_id column) by using the DISTINCT function and found none. A primary key is the field that uniquely identifies each record. It cannot contain duplicates or null values. No dataset is perfect but this was not the dirtiest I have seen so it did not need a lot to be done on cleaning. After making sure that everything is clean and tidy it is time to start answering the business questions above
Q1 top 10 products by revenue across each zone
I used the ROW_NUMBER() window function to get the rank of the total revenue per product and zone and sorted it by the revenue in descending order with the "desc" function to get the highest revenues first. This produces a rank of all the revenues of all products. This is where the WHERE clause comes in and filters to show only revenues ranked from 1 to 10 based on the rank provided by the window function. The subquery on the FROM clause was necessary because without it I wouldn't be able to use the alias for the window function in the WHERE clause. Total revenue is absent in the table so I calculated it myself by summing up the products of the unit price and order quantity for each product. We will come across this multiple times in this project

Sneak peek of results

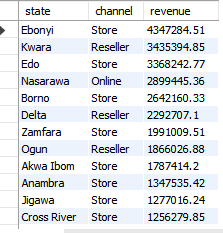
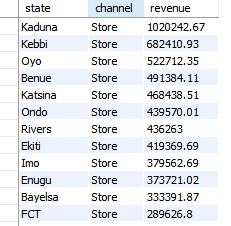
Q2 channels that generated the most revenue in each state
I needed another subquery here because a MAX(SUM()) function wouldn't work. So the result of the subquery contains the the sum of revenue for all channels across each state and the outer query uses the MAX() function to find the channel with the maximum revenue for each state. I used the ROUND() function to round the answer to 2 decimal places to make reading easier. We see the total revenue here again, which if you recall is the sum of the products of the unit price of all items and their order quantities

results
Q3 sales made per year
Over here and throughout this project I used the STR_TO_DATE() function to change my date to the right data type before working with it. In this query I used it with the YEAR() function to extract the year from the corrected date and calculated the total sales to find the sales per year

results

2012 was the year with most sales made with $18,368,505.24. Let's see if that equals year with most profit made in the next query
Q4 profit by year
Profit from this dataset = total revenue -total cost. Total revenue is the sum of the products of the unit price of all items and their order quantities and total cost is the sum of the products of the unit cost of all items and their order quantities. The year function makes another appearance here to help me group the profits by year.

results

2012 was in fact the year with the highest profits. I felt like this was not giving the full story concerning profits so even though it fell out of the scope of my assignment I decided to find the profit margins per year to get a better picture of the best performing year
Q5 profit margins by year
To find profit margin is to divide the profit obtained in Q4 above by the total revenue. I divided by 100 to get percentages

results
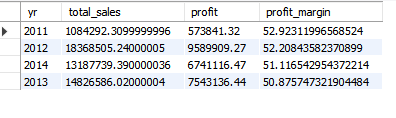
Although 2011 was the year with lowest sales and profit (because sales in 2011 only start in Q4 ), it has the highest profit margin 52.9%. This is an interesting insight that would require further investigation
Q6 products that sold the most in each zone in each year
Just like in Q1, to answer this question I needed to add up all order quantities, group by the products, and find the products with the highest order quantity in each zone and year. Since the sum and max functions do not work together I first created a subquery to get the total order quantities of all products with the SUM() function in each zone in each year and used MAX() function in the outer query to find the products with the highest number of orders

results

Q7 sales made when there is discount v no discount
To answer this question I used a common table expression, cte for short. A cte helps to simplify queries by acting as a virtual table. Since I have two values to find in this query I will have two select statements in the cte. To find sales when there is a discount I use the WHERE clause to filter the dataset on the promotion name field to find products and the corresponding promotion at the time of sale. And I do same for products with "no discount" in the promotion name field

results

There is a strong correlation between discounts and sales seeing as products with promotions and discounts sold 52% more than products with no discounts. Further analysis needed to get the full effect of discounts on sales
Q8 profit made when there is discount vs no discount
Again, I used a cte here which contained two select statements. I calculated for the profit and use the WHERE clause to filter the results on the promotion name field to find products and the corresponding promotion at the time of sale. And I do same for products with "no discount" in the promotion name field
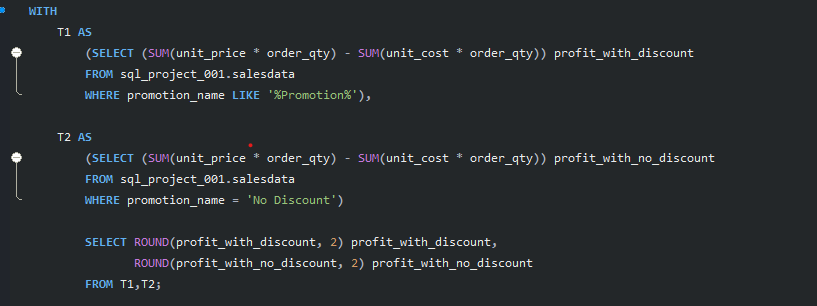
results

Products with discounts sold more and made more profit
Q9 revenue by product category

results
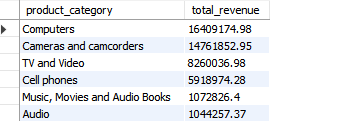
Computers generated the most revenue at $16,409,174.98
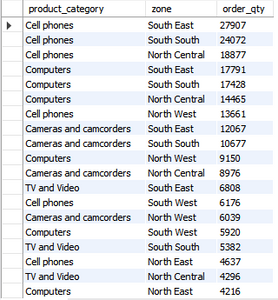
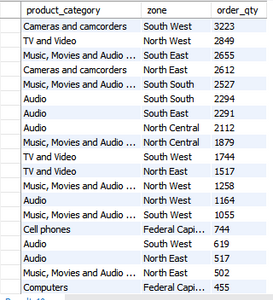
Q10 order quantity by product category and zone

results


Q11 top product category(sales) by quarter in each year
In this query I use a new function- QUARTER() to extract the quarters of the year and products that sold the most in each quarter of each year

results

Overall, Computers saw the highest sales quarter in quarter 1 of 2012 and topped at least one quarter each year with the exception of 2011. It topped two quarters in 2012 and 2014. With the exception of 2014, cameras and camcorders topped the sales in quarter 4 of every year. This might have something to do with the holidays approaching at that time of year but further investigation would be needed to establish how strongly correlated they are
Q12 products that are never out of stock
This was a tricky one but to find products that had been in stock for every month of every year I figured the count of distinct months had to be 12 for every month AND the count of distinct years had to be 4 for all the four years

results

From my query these are the only three products that met the criteria
Q13 products that are out of stock sometimes
For this I decided that for a product to meet the criteria it had to have been out of stock in at least one month OR one year. So if a product appeared in every year but not every month of every year my query returned it and if it appeared in all 12 months but not for all years my query returned that too.

sneak peak of results

Q14 profit margins by category
For the last question I calculated the profit margin, grouped by the product category and used the CASE expression to return the level of the profit margin which were high, mid or low.

results

Music, movies and Audio books had the highest profit margin. Computers, the best selling product had the lowest profit margin at 48.17%
Conclusion
Let's wrap it up shall we? We can conclude that in the period under consideration the customers preferred to buy at the physical stores. Overall, computers generated the most sales and profit but had the lowest profit margin. Music , Movies and Audiobooks had the highest profit margin. During the holiday season, Cameras and camcorders were usually the best selling products but they dropped off in 2014 which warrants looking into. A worrying pattern though is how sales and profit consistently dropped from 2012-2014. Customers LOVE their discounts. I get them, I do too.
You can find the complete code and dataset on my Github
Thank you for reading , I hope you enjoyed it. You are always welcome to join the "sequel" side and your suggestions are always welcome here. The goal is consistent growth


Comments