
Credit Default Risk Analysis
- Abdul-Sherrif Saaka
- Sep 13, 2022
- 2 min read

Updated: Feb 24, 2023
Hi again. This is the newest practice project I want to share with you. I hope you enjoy reading. It is always fun to work on something new and share it.
In this project my employer just wants to know the demographics of people defaulting on their credit card payments- where they are from, their ages, level of education, etc. So in the next minute or so I will provide answers and tell you how I went about getting my answers. I used power query and power bi for data cleaning, transformation and visualization.
Data Cleaning
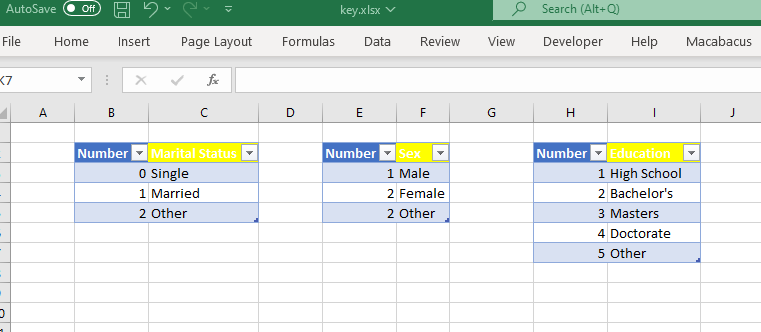
To begin, I was provided with two csv files. One with all the details of the customers and the other with keys to help me understand what certain fields in the main workbook meant. For instance, marital status was represented by either a 0 or a 1. And with the keys I was able to tell what the numbers meant. I loaded the customer data into power query.
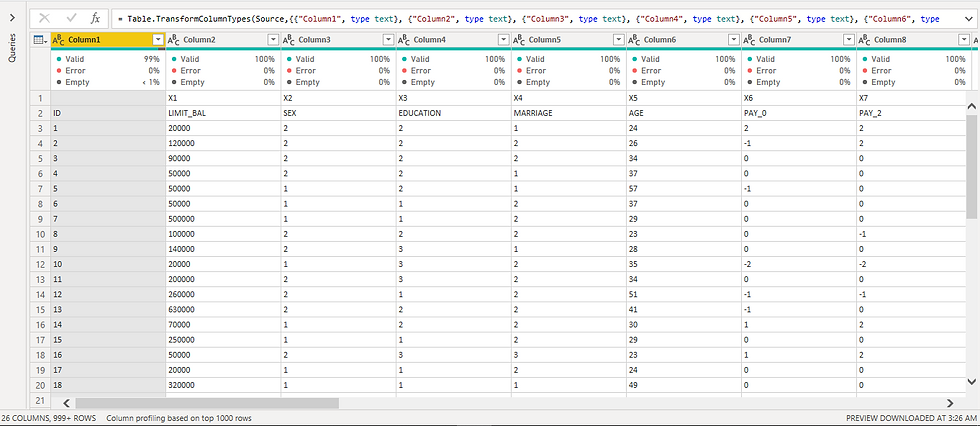
1.1 Sample of initial data
1.2 keys tables
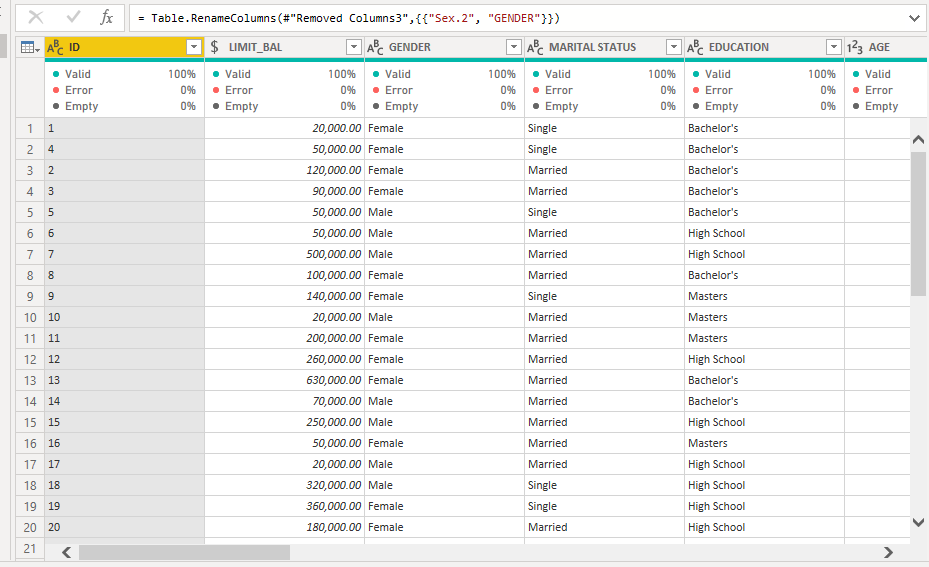
So, I get to cleaning my data. We can see that power query could not automatically detect the column headers in image 1.1 so we will have to fix that. The headers are in row 2. On the 'Home' tab in the ribbon there is an option to remove rows. I select that, choose to remove top rows from the drop down list, and type in 1 to remove the top one row. Now our headers are in the top row, but they are still not headers yet. Staying on the Home tab, I select 'Use First Row As Headers' and now get our right headers in place. Next I perform a Right Outer Join with the tables containing the keys and replace the respective values in the customer table. Now the data is clean and ready for analyzing.
1.3 Clean data sample
Visualization and Insights
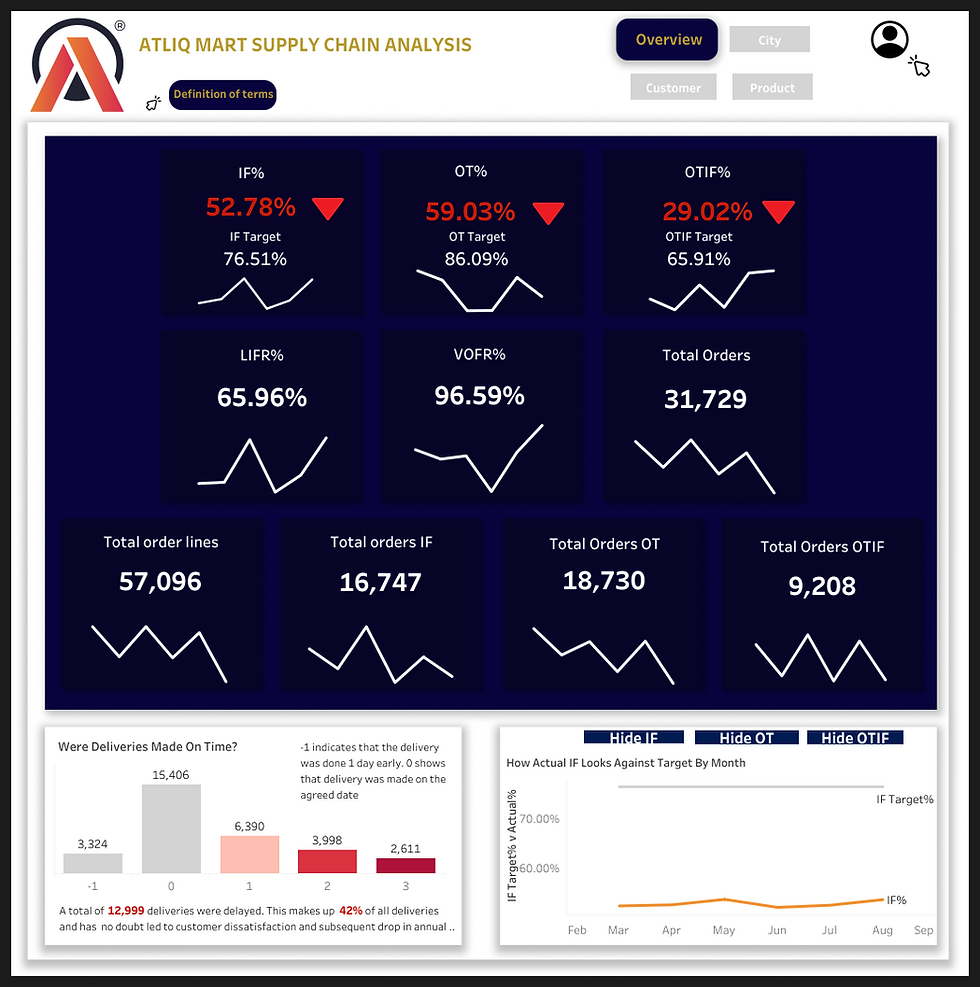
This was a simple assignment to find the demographics of defaulters to help the business make better decisions going forward. I put my findings in a dashboard to enable my manager interact with insights and draw further insights.
2.1 Dashboard
Follow this link for a better experience interacting with my report
I have said it before and I will just reiterate how great power query is. Power query and Power Bi equip you with a lot. And I know that personally, they have made data look much less daunting to me. Thank you for reading and I'll see you around.


Comments